Matching-algorithm-for-Raman-Spectra
Published:
Some intro
Recently I attended a workshop helping solve industrial problem hosted by the Fields Institute. One of the problems presented is developing accurate/efficient methods for matching Raman spectra from test sample to samples recorded in the library so that different chemicals can be detected effectively. This is a quite chanllenging problem. Theoretically speaking, though Raman spectroscopy is commonly used in chemistry to provide a structural fingerprint by which molecules can be identified, there are a huge amount of chemicals out in the nature among which many have quite similar Raman spectra. The fact that test samples are usually a mixture of different molecules make the problem even more difficult. Pratically speaking, spectra data recorded is not perfect. There will be noises of different kinds and background/baseline signal flooding the useful information.
Existing approaches are actually quite simple and can produce reasonable results. Empirically, components that has low percentages within the inspected compounds will received a very low matching score when using methods like dot product or correlation, hence not being able to identify it when comparing with the library. On the other hand, distance based method will provide a higher score for low-percentage components but is not as sensitive.
Some thoughts
I was thinking about using 1d convolutional networks to do the detection as did in the leaf classification when I first saw this problem. I soon abandoned this idea since their library at hand only has one instance per molecule. It probably can be expanded by some augmentation techniques, but I suspect it bring much benefit. Our group ended up choosing the direction with analytical approaches. From the physics point of view, one of the most important footprints in the Raman spectral that help code different chemicals is the location of peaks. In order to obtain such parameters, we will first truncate the spectra within a universal window (wavenumber from 200 to 1800), normalized the truncated spectra by its $L_2$ norm, smooth the data by the moving average method and then use function find_peaks_cwt from scipy.signal package.
The following figure shows an example of detected peaks.
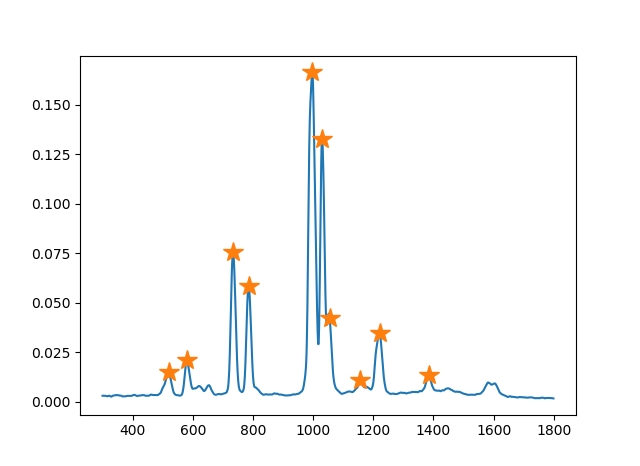
We do not use all the peaks from its output but first $N$ peaks ranked by their intensity. It helps to reduce unnecessary errors since peaks outputted from find_peaks_cwt with low intensity could be misdetections.
One way to proceed from this is to approximate these peaks with Gaussians, then apply existing methods on these approxiated “spectra” instead of original ones. Our limited experiments shows this idea acutually can give comparable/better results. Another way we considerred is by completely ignoring the intensity information, limiting ourselves to the most significant info at first by just considering locations of these peaks. Of course, one can directly apply formulas on these vectors consisting of peak locations, we went one step furter by considering converting it to a peak distribution.
We did it in an easy way by converting these peak locations using histograms. We then use Jensen-Shanon divergence as the similarity metric between the converted distribution from two spectra. On a very small but selected test dataset where tradtional methods does not perform well with <10 Bezene derivatives (their chemical structures are quite similar), we were able to get some nice results:
| Mixture ID | Composition | Prediction (Top 3) |
|---|---|---|
| S1 | O-xylene, Toluene | O-xylene, Toluene, Pyridine |
| S2 | Aniline, Pyridine | Aniline, O-xylene, Polystyrene |
| S3 | Aniline, O-xylene | O-xylene, Pyridine, Polystyrene |
| S4 | O-xylene, Pyridine | O-xylene, Pyridine, Toluene |
| S5 | O-xylene, Pyridine, Toluene | O-xylene, Pyridine, Toluene |
| S6 | Aniline, Toluene | Polystyrene , Analine, Toluene |
Some further thoughts
Preprocesss plays a very important role here, commercial handheld spectromter is able to perform reasonable well using easy metrics such as dot product or correlation even with libraries containing thousands of samples. Preprocess steps that help hightlight information contained in peaks certainly will help bring up the performance and robustness of ideas as above. Also, find_peaks_cwt may not do a good job in some of our samples, other implementations probably can do better in peak detections, this blog contains some of them to try out. Incorporating other information other than just the peak locations into our ideas may also help the improvements.